
Predicting patient health outcomes by creating an intelligent, automated measurement validation system based on AI/ML in Hospital Quality Reporting
The iAdeptive team proudly collaborates with CMS to develop AI solutions for predicting patient health outcomes in conjunction with the Information Systems Group (ISG). Leveraging advanced AI tools, including deep learning, we expedited the development process. ISG, operating under the Center for Clinical Standards and Quality (CCSQ), assumes the critical role of designing, constructing, and maintaining innovative healthcare IT systems. These systems are tailored to optimize CCSQ quality programs. Within CCSQ’s purview lies the responsibility of creating, testing, evaluating, adopting, and supporting performance measurement systems, specifically quality measures, which assess the care provided to CMS beneficiaries.
CCSQ is the driving force behind instituting a CMS-wide strategy for assessing and advancing healthcare quality, while also establishing priorities for clinical quality enhancement. Under ISG’s Hospital Quality Reporting (HQR) Program, more than 4,700 hospitals annually submit quality data across various programs. This data plays a pivotal role in adjusting annual payment updates to healthcare providers and furnishing beneficiaries with information to make more informed decisions regarding their healthcare. The accuracy of this data holds paramount importance, especially in the context of public reporting and payment programs. By publicly reporting healthcare quality data, consumers are empowered to make educated choices about their healthcare providers, which in turn, fosters improvements in overall quality.
Scope
- AI Product Development
- AI Strategy Consulting
- Data management & Intelligence
Objective
The objective of the Artificial Intelligent Pilot – HAIP – is to establish an intelligent and automated measurement validation system within the Hospital Quality Reporting (HQR) framework, driven by the capabilities of Artificial Intelligence and Machine Learning (AI/ML).
The AI/ML anomaly detection project is designed to achieve the following objectives:
- Enhance the quality of healthcare measures by identifying and flagging unusual patterns or deviations from expected scores.
- Harness the power of machine learning models to promptly detect anomalies in real-time, facilitating early intervention and the prevention of potentially costly errors.
- Efficiently identify anomalies through the analysis of historical data, reducing the likelihood of overlooking validation errors and ultimately enhancing patient outcomes.

The —
Solution
Approach
During a span of 12 weeks, the iAdeptive team undertook an extensive process encompassing analysis, design, and development of AI/ML models. This also involved rigorous training and assessment of model outcomes. The following details elucidate the structured phased approach employed for the model development.
01. Data Collection
Data Consolidation and Processing involves the collection and systematic organization of data from diverse sources or files.
02. Data Curation
Data Curation involves the following steps:
- Data Processing and Interpretation: In this phase, data undergoes a series of operations including cleaning, integration, and transformation to prepare it for machine learning analysis.
- Data Aggregation and Labeling: This step involves the labeling of data to facilitate model learning.
- Data Visualization: The final stage of data curation involves generating visual representations of the data to uncover patterns and trends.
- Feature Engineering: This process focuses on the creation and selection of optimal input variables to enhance the performance of machine learning models. It addresses issues with raw data and enhances predictive accuracy.
03. Modelling & Deep Learning
Multiple models were developed and evaluated to identify the most suitable one for a particular measure. Three models were employed, including XGBoost regression (a supervised approach), Isolation Forest (an unsupervised method), and an ensemble model that incorporates Isolation Forest results. Furthermore, an AWS-based architecture was created to automate the entire process.
04. Outcome Aggregation
Perform a comparative analysis of outcome results obtained from three distinct models to ascertain the optimal model.
HAIP Data Processing and Feature Engineering
The HAIP project employed publicly available data from HQR, which underwent a comprehensive preprocessing pipeline. This process involved data consolidation, aggregation, and standardization to ensure uniform formatting and consistency. The Measure-Specific Dataset was subjected to quality checks to confirm the absence of duplicate provider-quarter combinations and verify the integrity of data values within the expected format and range.
Feature Engineering
Feature engineering is a crucial step when working with datasets with relatively few features. In the HAIP project, feature engineering played a vital role in enhancing model performance. This involved the calculation of rolling mean scores for each provider to assess performance changes over time, as well as the introduction of lagged and differenced scores. Both supervised and unsupervised algorithms were employed to validate model predictions for accuracy.
Modeling Algorithms
XGBoost:
XGBoost is a predictive modeling algorithm that leverages gradient boosted trees. This approach combines multiple decision tree models to create a single, high-performance model.
Isolation Forest:
The Isolation Forest algorithm explicitly focuses on modeling anomalies. It constructs a series of tree-based models to calculate anomaly scores ranging from 0 to 1, with higher scores indicating a higher likelihood of an observation being an anomaly.
Ensemble Model:
The Ensemble model used an XGBoost regression model, incorporating anomaly scores from the Isolation Forest model as an additional modeling variable. This approach created a chained ensemble model where the results of the Isolation Forest contributed to the XGBoost Regression model. This strategy was chosen to expand the feature space within the modeling dataset and provide additional information for the model’s consideration.
Model Selection
The comparison of candidate models for the XGBoost regression and ensemble models involved a 5-fold cross-validated Root Mean Square Error (RMSE) calculation, averaged over 10 repetitions. In cases where multiple models exhibited similar RMSE values, the model with the most conservative parameters was chosen.
For the Isolation Forest model, candidate models were evaluated using the Area Under the Receiver Operating Characteristic Curve (AUROC). Similar to the XGBoost models, in situations where multiple models demonstrated comparable AUROC values, the model with the most conservative parameters was selected.
Subsequently, XGBoost regression and ensemble models with the final chosen parameters were trained and applied to the entire dataset. Anomaly predictions were determined based on the optimal thresholds, considering the absolute difference between the actual measure score and the predicted measure score. In the case of the Isolation Forest model, the optimal threshold was applied to the anomaly score to assign anomaly predictions.
Results
Identification of Anomalies in scores associated with HQR Programs
The iAdeptive team has proposed a deep learning solution to enhance the accuracy of the healthcare data validation process. This solution leverages AI/ML techniques to improve the efficiency of anomaly detection by analyzing historical data. By adopting this innovative approach, we aim to significantly enhance the precision of published healthcare data, benefiting the entire healthcare community.
In this specific use case, we harnessed AI/ML techniques to craft a model designed for the identification of anomalies in the published scores associated with HQR Programs. This model relies on historical data to predict measure scores accurately.
As illustrated in Figure 1, the integration of AI models into the quality measure validation process is depicted. The development of AI models involves the utilization of data spanning multiple years of measured data, accompanied by meticulous model design and rigorous evaluation. Consequently, AI models contribute to the timely and effective validation of measured data, mitigating the risk of publishing inaccurate information. This approach ultimately leads to improved outcomes in terms of effectiveness, safety, efficiency, and patient-centered care.

OP-10 Analysis Summary
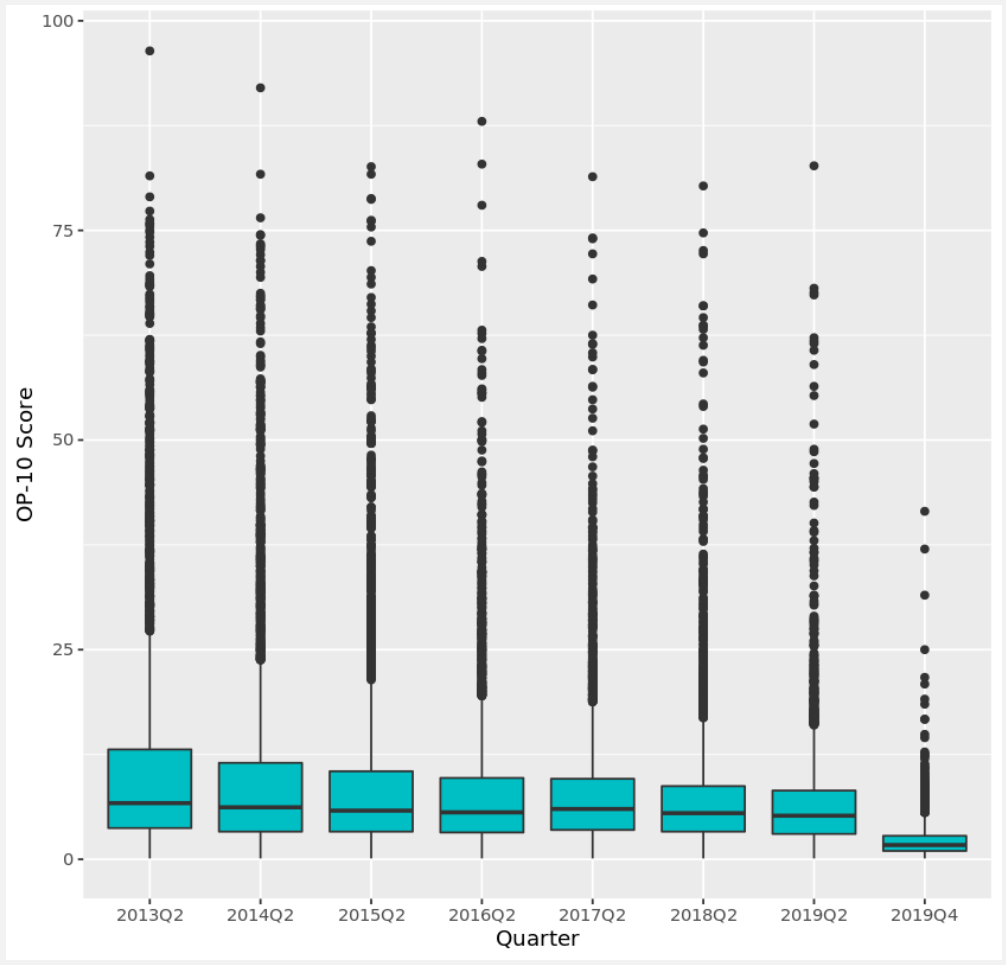
In Figure 2, we present the distribution of OP-10 scores across different quarters. OP-10, like many other measures, follows the trend where lower scores are indicative of better performance. Most scores tend to cluster towards lower values, with a median score of 5.1.
Upon closer examination, when we compare the boxplots for each quarter, a distinct pattern emerges in 2019 Q4. During this period, the score distribution consistently appears lower than in other quarters. The ability to detect and confirm such anomalies stands as a robust indicator of the real-world performance of our models.
Model Performance Evaluation
Table 1 presents the performance metrics for the OP-10 models. Overall, the models exhibit excellent performance, with the ensemble model demonstrating a cross-validated Root Mean Square Error (RMSE) of 2.77 and an Area Under the Receiver Operating Characteristic (AUROC) of 0.914. Notably, the ensemble method outperforms the standard XGBoost regression model, highlighting its effectiveness.
Excluding the 2019 Q4 data, the OP-10 measure scores exhibit a standard deviation of 8.7. The ensemble model, with its RMSE of 2.77, typically predicts a provider’s score within a few points. Optimal performance, with an AUROC of 0.91, was achieved using a threshold of 3. Any reported score differing by more than 3 points from the model’s prediction was classified as an anomaly.
| XGBoost Regression |
Isolation Forest |
XGBoost Ensemble |
|
|---|---|---|---|
| CV RMSE | 5.86 | N/A | 2.77 |
| AUROC | 0.83 | 0.77 | 0.91 |
| Absolute Difference from Previous Score | |||||||||
|---|---|---|---|---|---|---|---|---|---|
| Mean |
Std. |
1% | 10% | 25% | 50% | 75% | 90% | 99% | |
| Model Predicted Normal | 2.10 | 3.21 | 0 | 0.20 | 0.50 | 1.30 | 2.40 | 4.40 | 15.77 |
| Model Predicted Anomaly | 6.09 | 4.74 | 1.10 | 2.40 | 3.30 | 4.80 | 7.30 | 11 | 25.59 |
| Absolute Difference from Provider Mean | |||||||||
|---|---|---|---|---|---|---|---|---|---|
| Mean |
Std. |
1% | 10% | 25% | 50% | 75% | 90% | 99% | |
| Model Predicted Normal | 3.01 | 4.92 | 0.02 | 0.25 | 0.65 | 1.53 | 3.10 | 6.77 | 26.67 |
| Model Predicted Anomaly | 7.26 | 6.38 | 0.43 | 2.20 | 3.48 | 5.26 | 8.67 | 14.57 | 31.96 |
Table 2 illustrates that anomalies identified by the model exhibit an average change of 6.09 points from a provider’s previous score and deviate by an average of 7.3 points from the provider-level mean. In contrast, normal OP-10 scores undergo an average change of 2.1 points from their previous scores and deviate by an average of 3.0 points from the provider mean.
Anomaly Detection Results
OP-10 presented an excellent opportunity to assess the anomaly detection models in a quasi real-world context. Initially, approximately 40% of observations for 2019Q4 were incorrectly classified as non-anomalies. However, it’s worth noting that only about 10% of that 40% exhibited score changes indicative of data issues. This implies that the OP-10 anomaly detection model maintains an estimated error rate of merely 4%. Moreover, when examining OP-10 outcomes collectively, the substantial increase in the proportion of anomalies in 2019Q4 serves as a conspicuous signal of underlying systematic data issues.
Combining a low error rate with readily discernible aggregate indicators, the OP-10 case study underscores the effectiveness of the anomaly detection framework developed during the HAIP project in proactively identifying anomalous data before its public release.
A noticeable pattern emerges when examining the predicted anomaly counts. All three models reveal a substantial surge in the number of suspected anomalies during the 2019Q4 period, with the ensemble model exhibiting this trend most prominently. To provide context, the model identified approximately 60.1% of the data in 2019Q4 as anomalies.
Benefits
As part of the HAIP Project, supported by the CMS AI Explorer Program, iAdeptive conducted a pilot that demonstrated the feasibility of AI/ML technology in addressing a CCSQ business use case. This pilot served as a valuable learning experience and yielded several key takeaways:
- Reliability: The pilot validated the model's ability to predict anomalies, particularly in cases like OP-10 where issues were known to exist.
- Productivity: By uncovering previously overlooked anomalies, the model highlighted the presence of outliers in other measures. This underscores the need for a more strategic approach to data validation, preventing many anomalies from going undetected.
- Efficiency: The automated approach significantly reduces the time required for anomaly detection. While some initial refinement was necessary, it resulted in substantial time savings.
- Scalability: The team is confident that once the platform and engine are production-ready, the onboarding of measures with new data sets will be expedited compared to the pilot phase. This scalability potential could save weeks critical for measure validation.
- Planning and Alignment: The approach shed light on areas for improvement within the Measure Calculation and Validation team. It enables quicker identification and resolution of issues, enhancing overall efficiency.
Key Facts
Conclusion
Anomaly detection with AI/ML: Unearthing the unseen
Achieving an AI-driven digital transformation necessitates extensive cross-functional collaboration and the involvement of diverse skill sets. To effectively navigate this transformation, a well-structured AI roadmap is imperative. This roadmap should encompass key steps such as identifying, assessing, and prioritizing AI use cases. In this context, this case study presents a comprehensive methodology and a set of best practices that can significantly expedite quality improvement initiatives aimed at advancing equitable healthcare.
- Unlocking Insights with AI/ML-Powered Anomaly Detection: The utilization of AI/ML-powered anomaly detection holds the potential to unearth concealed patterns and identify outliers and anomalies. This capability can lead to the discovery of new insights and opportunities within healthcare data.
- Advancements in Anomaly Detection: After months of dedicated research within the HAIP project, we are confident that our anomaly detection approach represents a substantial leap forward in the evaluation of healthcare measure data. It serves to mitigate the risk of publishing incorrect scores.
- Documentation of Innovative Approach: Our groundbreaking approach to measure validation has been meticulously documented in a white paper, providing a comprehensive resource for understanding and implementing this methodology.
- General Applicability: The approach outlined in this document is not limited to a specific subset of healthcare measures. It can be broadly applied across various healthcare measures within HQR and extended to other programs within CCSQ.
- Demonstrated Efficacy: The initial findings from the HAIP project underscore the model's efficacy and its valuable role in detecting outliers, producing meaningful results with far-reaching implications.